Lancaster & Morecambe 01524 843322
Posted on Thursday, March 4, 2021
It was late March when the housing market came to a standstill along with the rest of the UK. The big thing about lockdown 3.0 is that estate agents can remain open and the pent up demand to get moved continues, although interestingly the number of property sales agreed is identical to 2020. The big issue now is the lack of choice and it is this that is driving property prices upwards….
Here are your figures for February 2020
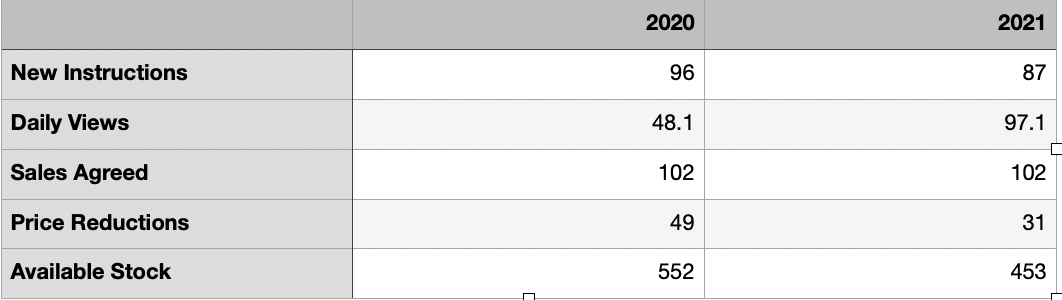
February is the 2nd month in a row in 2021 where the number of new properties coming available dropped. Many home movers have put plans on hold, many waiting for the Spring Budget news, others for lockdown restriction to ease and many waiting for the kids to go back to school. Signs are this is set to ease in the forthcoming weeks, especially given the extended stamp duty incentives announced in the Spring Budget.
Rightmove records the average number of daily views postcode sector by postcode sector. As you can see the number of people looking online has doubled. This is a clear indication of buyer demand. The average property had 97.1 daily views. JDG clients however averaged at 127. This figure is quite important. More people viewing your property online = more viewings = higher chance of successfully selling.
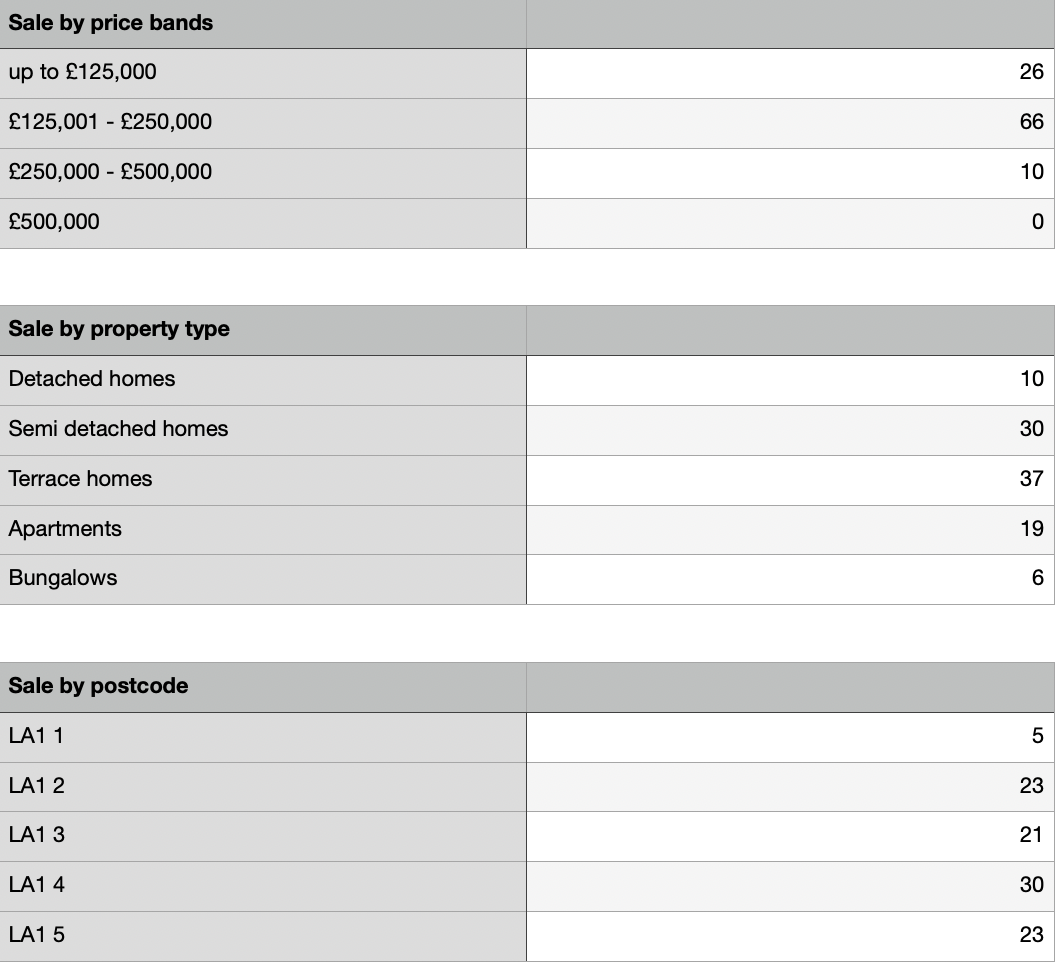
If you study the graph below, it helps you understand what is selling where. 90% of all the property sales in February were under £250,000. There was also no sales above £500,000. There were just 4 sales priced above £300,000. The most expensive home to go under offer was on Maplewood Gardens, Burrowbeck. This was sold by our company and the asking price was £415,000.
Apartment sales increased by a huge 280%. This is positive news, especially given the fact we reported last month that over 1/3 of all properties listed for sale were apartments.
Despite the increasing demand for properties in Lancaster, property prices have still kept relatively stable. Across the postcode LA1 (which covers North, Central and South Lancaster), the average price for a 3-bed semi-detached home stands at £170,405. The average detached home is now £297,457. The average terrace is just £137,291. It will be interesting to see how this changes in future months, especially given the latest budget changes with the stamp duty and the country’s plan to ease lockdown,
The housing market is currently the strongest we have seen since 2006. Property Prices are up. The demand for property is up. The biggest issue now is the lack of properties available for sale. We have buyers waiting.
20 agents were involved with the 102 property sales in February. At JDG we agreed 22 of these sales (21.6% of all the sales). Many of our properties were snapped quickly. Dumbarton Road, Westbourne Road, Maplewood Gardens, Parkfield Drive, Victoria Avenue and Barley Cop Lane were just some of the homes which sold in days. Several had multiple offers. .
In February we registered another 173 people looking to buy locally. That is now 1815 looking to move across the area since the first lockdown eased in May 2020.
Are you thinking of moving? Think JDG. We would love to help. Call us on 01524 843322 or email michelle@jdg.co.uk
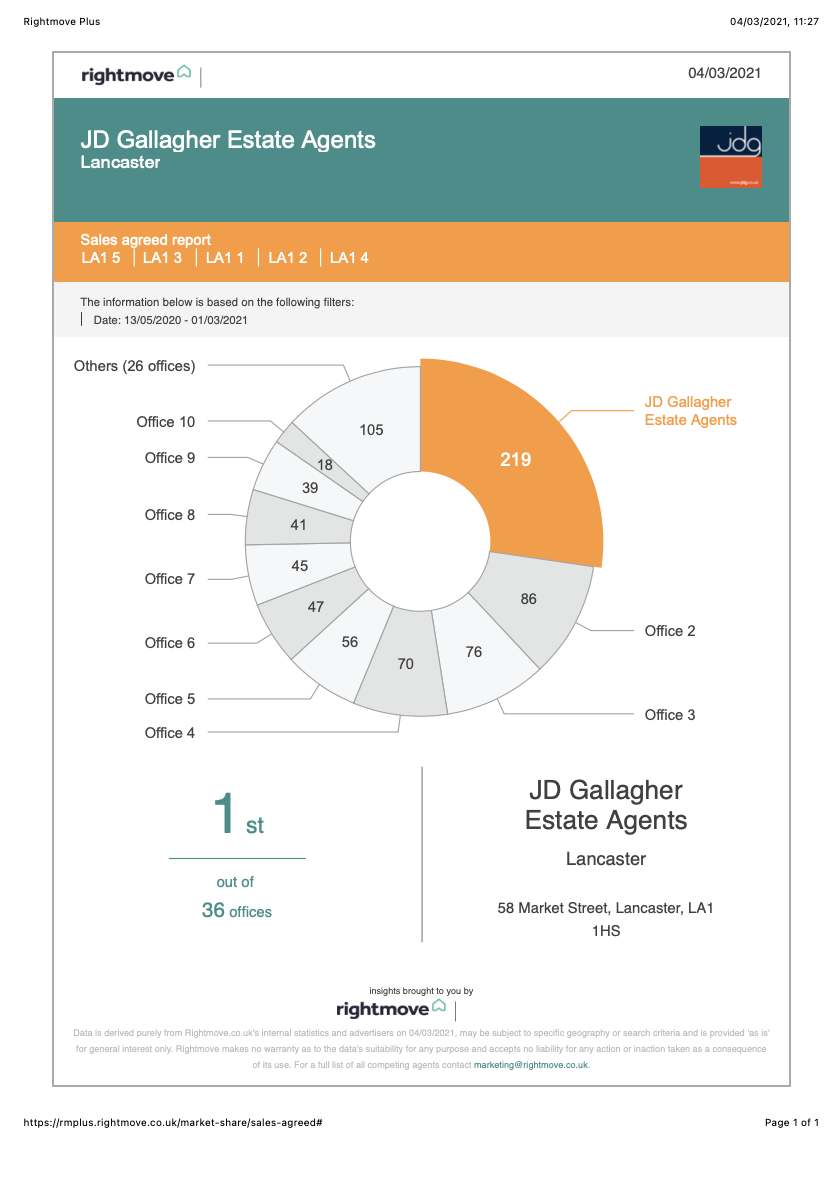
Here is the sales results graph for LA1 since the first lockdown eased in May 2020. The offices represent different estate agent brands across the region. The numbers are the number of properties each agent has successfully sold (STC).